Witam,
Chciałbym na swojej stronie internetowej wyświetlić wykres używając danych z bazy przy użyciu google charts. Mam taką oto bazę: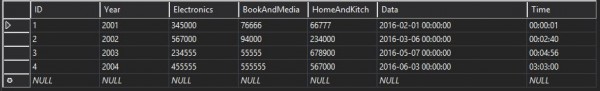
Są to przykładowe dane do poćwiczenia.
Kod kontrolera:
using System;
using System.Collections.Generic;
using System.Linq;
using System.Web;
using System.Web.Mvc;

namespace GoogleProba.Controllers
{
    public class GoogleChartController : Controller
    {
        // GET: GoogleChart
        public ActionResult Column()
        {
            return View();
        }
        public JsonResult GetSalesData()
        {
            List<SalesData> sd = new List<SalesData>();
            using (MyDatabaseEntities dc = new MyDatabaseEntities())
            {
                sd = dc.SalesData.OrderBy(a => a.Data).ToList();
            }

            var chartData = new object[sd.Count + 1];
            chartData[0] = new object[]{
                    "Data",
                    "Electronics",
                    "Book And Media",
                    "Home And Kitchen"
                };
            int j = 0;
            foreach (var i in sd)
            {
                j++;
                chartData[j] = new object[] { i.Data, i.Electronics, i.BookAndMedia, i.HomeAndKitch };
            }

            return new JsonResult { Data = chartData, JsonRequestBehavior = JsonRequestBehavior.AllowGet };
        }
    }
}
Oraz kod widoku:
@{
    ViewBag.Title = "Column";
}

<h2>Column Chart With Animation</h2>

<br />
<div id="visualization" style="width:600px; height:300px">

</div>

<script type="text/javascript" src="https://www.google.com/jsapi"></script>
<script type="text/javascript" src="//ajax.googleapis.com/ajax/libs/jquery/1.10.2/jquery.min.js"></script>
@section Scripts{
    <script>
                    $(document).ready(function () {
                        //Load Data Here
                        var chartData = null;
                        $.ajax({
                            url: '/GoogleChart/GetSalesData',
                            type: 'GET',
                            dataType: 'json',
                            data: '',
                            success: function (d) {
                                chartData = d;
                            },
                            error: function () {
                                alert('Error!');
                            }
                        }).done(function () {
                            drawChart(chartData);
                        });
                    });

                    function drawChart(d) {
                        var chartData = d;
                        var data = null;
                        data = google.visualization.arrayToDataTable(chartData);

                        var view = new google.visualization.DataView(data);
                        view.setColumns([0, {
                            type: 'date',
                            label: data.getColumnLabel(0),
                            calc: function () { return 0; }
                        }, {
                            type: 'number',
                            label: data.getColumnLabel(1),
                            calc: function () { return 0; }
                        }, {
                            type: 'number',
                            label: data.getColumnLabel(2),
                            calc: function () { return 0; }
                        }, {
                            type: 'number',
                            label: data.getColumnLabel(3),
                            calc: function () { return 0; }
                        }]);

                        var chart = new google.visualization.LineChart(document.getElementById('visualization'));
                        var options = {
                            title: 'Sales Report',
                            legend: 'bottom',
                            hAxis: {
                                title: 'year',
                                format: '#'
                            },
                            vAxis: {
                                minValue: 0,
                                maxValue: 1000000,
                                title: 'Sales Amount'
                            },
                            chartArea: {
                                left:100, top: 50, width:'70%', height: '50%'
                            },
                            animation: {
                                duration: 1000
                            }
                        };

                        var runFirstTime = google.visualization.events.addListener(chart, 'ready', function () {
                            google.visualization.events.removeListener(runFirstTime);
                            chart.draw(data, options);
                        });

                        chart.draw(view, options);

                    }

        google.load('visualization', '1', { packages: ['corechart'] });

    </script>
}
Mój problem polega na tym że gdy na osi X umieszczę dane z kolumny "Year" to wykres ładnie mi się generuje. Gdy zmienię to na datę bez zmiany typu przy generowaniu wykresu (type: 'number') wykres także się generuje lecz zamiast daty na osi wyświetlają sie ciągi liczb nic mi nie mówiące. Gdy już zmienie typ danych na "date" tak jak w kodzie powyżej wyskakuje mi błąd: "All series on a given axis must be of the same data type". Domyślnie chciałbym wyświetlać sam czas jednak przy samym czasie nic się nie pojawia.
Czy jest ktoś w stanie rozwiązać mój problem albo podpowiedzieć jak inaczej łatwo wygenerować wykres z danych z bazy wyświetlający czas? Z góry dzięki.